Air Quality Index (AQI)
The Air Quality Index (AQI) is an index for reporting daily air quality. It tells you how clean or polluted your air is, and what associated health effects might be a concern for you. The AQI focuses on health affects you may experience within a few hours or days after breathing polluted air. EPA calculates the AQI for five major air pollutants regulated by the Clean Air Act: ground-level ozone, particle pollution (also known as particulate matter), carbon monoxide, sulfur dioxide, and nitrogen dioxide. For each of these pollutants, EPA has established national air quality standards to protect public health .Ground-level ozone and airborne particles are the two pollutants that pose the greatest threat to human health in the United States.
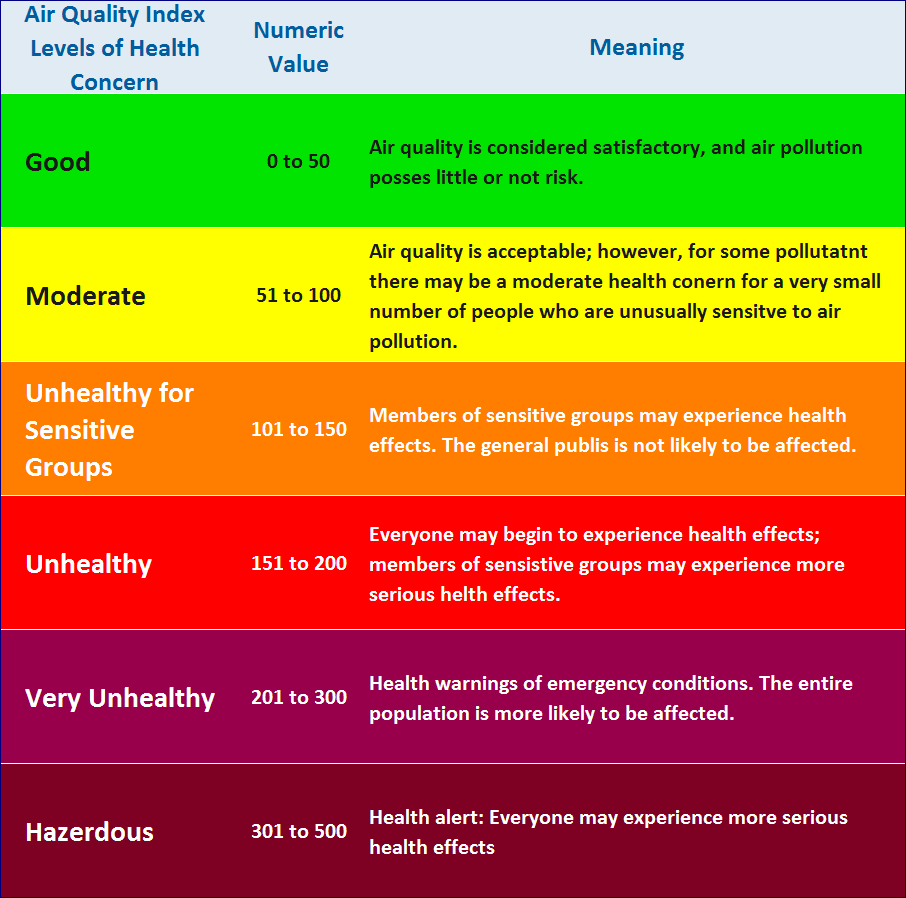
The air quality index reports are quality in categories. Each category corresponds to a different level of health concern. The six levels of health concern and what they mean are:
"Good" AQI is 0 - 50. Air quality is considered satisfactory, and air pollution poses little or no risk.
"Moderate" AQI is 51 - 100. Air quality is acceptable; however, for some pollutants there may be a moderate health concern for a very small number of people. For example, people who are unusually sensitive to ozone may experience respiratory symptoms.
"Unhealthy for Sensitive Groups" AQI is 101 - 150. Although general public is not likely to be affected at this AQI range, people with lung disease, older adults and children are at a greater risk from exposure to ozone, whereas persons with heart and lung disease, older adults and children are at greater risk from the presence of particles in the air.
"Unhealthy" AQI is 151 - 200. Everyone may begin to experience some adverse health effects, and members of the sensitive groups may experience more serious effects.
"Very Unhealthy" AQI is 201 - 300. This would trigger a health alert signifying that everyone may experience more serious health effects.
"Hazardous" AQI greater than 300. This would trigger a health warnings of emergency conditions. The entire population is more likely to be affected.
For a full explanation of the AQI, or to view the AQI for your area, visit http://www.airnow.gov
Source: Airnow. 2012. Air Quality Index (AQI) - A Guide to Air Quality and Your Health. Accessed on 24 January 2012. Available at http://www.airnow.gov